Link to Project:
![]()
The Short Of It
If you’re short on time, here is a quick list of some things I learned in this project:
- Defining project scope based on quality of data. What is missing, what is useful, what makes a good user case?
- Handling missing data of all types throughout code. If you’re allowing arbitrary (structured) data to be input by a user, you must be ready for any and all data to be missing. You can often force data into a format or type, but you can’t force it to exist.
- How painful large file storage is. Especially if you do not want to pay for it. Smaller data is worth the effort.
- Avoid monkey patches at all costs. When your project becomes more complex you will be hurt.
- Use session and retry protocol in http requests to improve performance and reduce errors.
- Implementation of asynchronous http requests with Grequests to overcome IO bounding.
- My source website pushed a slew of buggy updates mid-development. Gave me an opportunity for lots of real-world error handling experience. Website changed critical elements to javascript rendering, forced switch to Selenium.
- Use of LXML parser speed improvements with Beautifulsoup for performance improvements.
- Implementation of multithreaded computation with Pandarallel for CPU bound performance improvements.
- Category datatyping to reduce dataframe size.
- Pandas applying complex non-standard functions onto a groupby object.
- Pandas applying functions with multiple inputs and outputs.
- Memoization / caching for performance improvements in Streamlit, not performing redundant computation.
- Watching someone who has never used the app use it and recognize front-end usability improvements.
- Front end coding practices to ensure consistent theme. Presentation is critical to user perception of quality.
Introduction
This write-up is essentially a dumping ground for my thoughts on what the difficult parts of this project were. I suppose the point is if I ever return to this project, I can review this to avoid making the same mistake twice.
If you are unfamiliar with climbing terminology, please refer to this explainer.
Giza is a data analysis tool that allows users of the popular rock climbing website Mountain Project to discover deeper insight into their past performance and potential future climbs.
Mountain Project (MP) aggregates user data to provide information about specific climbs. It informs the user on the location, difficulty, length and required gear. It also allows images to be posted, provides an area for users to post opinions / warnings, and pools data on user performance for each climb.
Users typically have two lists. A “tick” list is a diary of the climbs the user has attempted and provides details on when the climb was done, whether the climber was successful, and any other notes. A “to-do” list is simply a list of climbs the user would like to climb in the future.
From these two lists there arises two inherent use cases. A tick list allows a user to analyze their past performance, and a to-do list helps a climber find their next climb. While Mountain Project provides some tools to aid in these goals, they are limited in their scope and usability.
Giza provides three primary features that Mountain Project currently lacks:
- Homogenizes grades and cleans the data so that comparisons can be made between every climb in the dataset.
- Analyzes tick data to provide additional metrics by which to quantify a climb.
- Provides filterable plots to visualize metrics and performance.
Built With
Libraries:
- Pandas and Numpy - Basic data analysis libraries
- Plotly - Plotting and visualization
- Requests - HTTP requests
- Selenium - HTTP requests for pages w/ javascript
- BeautifulSoup - HTML parsing
- Streamlit - Web app framework
Streamlit Components:
- STQDM - TQDM style download bars for streamlit
- Streamlit_aggrid - Ag Grid tables for streamlit
- Streamlit_nested_layouts - Enables nested columns and toggles
Different Treatments For Different Data Types
There are FOUR major forks in how data is handled and to what purpose within the scope of this app.
Tick vs. ToDo/Area
The core difference is already covered in the introduction. The effective difference is notable in the dataset itself.
Tick lists include additional columns such as: Date, Notes, Style and Lead Style. These values pertain to the way in which the climb was carried out by the specific user. Strangely, todo and area lists will provide the official pitch count of a climb in the “Pitches” column. Tick lists however will use the number of pitches the user submitted in the tick. These are two different values under the same column name. Not cool.
Roped vs. Boulder
Roped climbing climbs longer routes using a rope. Bouldering climbs boulders without a rope. From a data analysis perspective, the primary difference is in how users typically record effort. A clean send of a boulder is typically achieved after a great many attempts, typically on the scale of >20. Few if any boulderers record every little attempt, at most recording a “session”. In contrast, due to their length, roped climbs are typically not attempted as many times, typically in the <20 range. For this reason, it is reasonable to record each attempt. This allows for much greater data density on roped climbs. This is extremely pronounced for the MP dataset.
Additionally, roped climbs have more specificity when it comes to style. Boulders are either climbed clean the first time for a “flash/onsight”, climbed clean after attempts for a “send”, or fallen on for an “attempt”. Roped climbs in contrast are either led, followed, or top roped. Leading requires a climber to climb above gear and clip protection as they ascend. It is more difficult and dangerous. It is considered a more legitimate style than top-roping or following, as those styles require someone else lead the route for you to set it up. If led, they are either climbed clean the first time for a “flash/onsight”, climbed clean after attempts for a “redpoint”, or fallen on for a “fell/hung”.
The result of these effects is that better data can typically be yielded from the ticks of a roped climb versus a boulder. Since I’m primarily a roped climber myself, I’m ok with that…
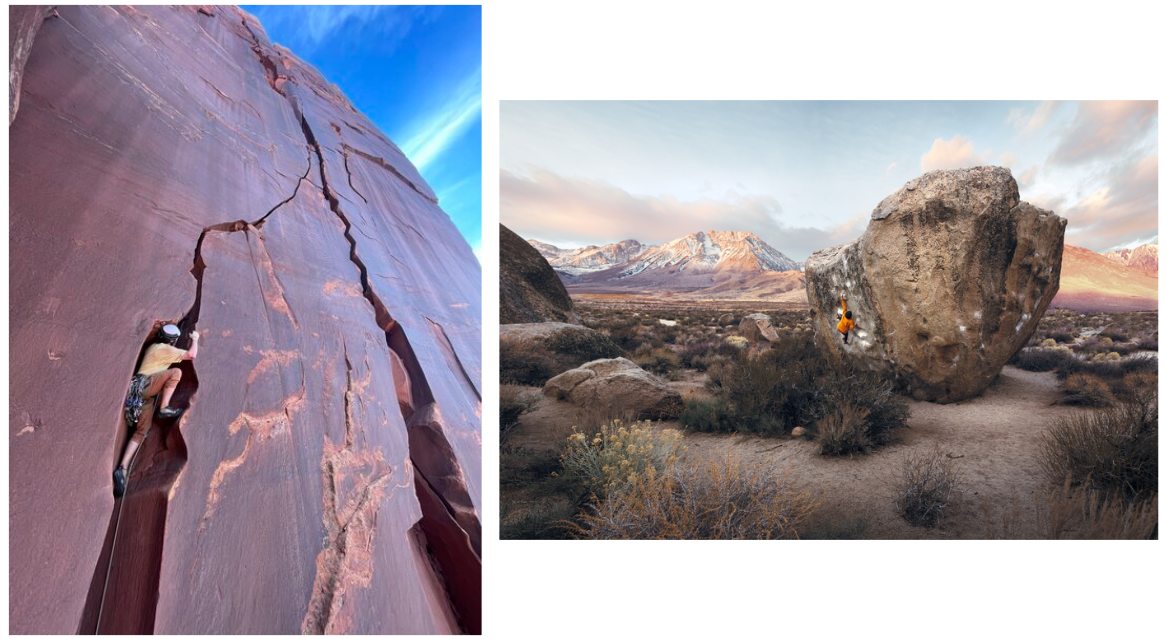 Roped Climbing (Left), Bouldering (Right) [Source 2]
Trad vs. Sport
Traditional, AKA trad climbing, came first. It originally used hammered pitons to catch a fall. It was recognized that this damaged the rock, so climbers transitioned to “clean” protection that does not damage the rock when used. These are either chockstones which are jammed in constrictions or camming devices.
Sport climbing developed to allow for routes where natural protection does not exist. Climbers clip into pre-installed bolts on the wall.
The styles are different enough that most people track their progress for the two disciplines separately, so it is important that the tool allows for that.
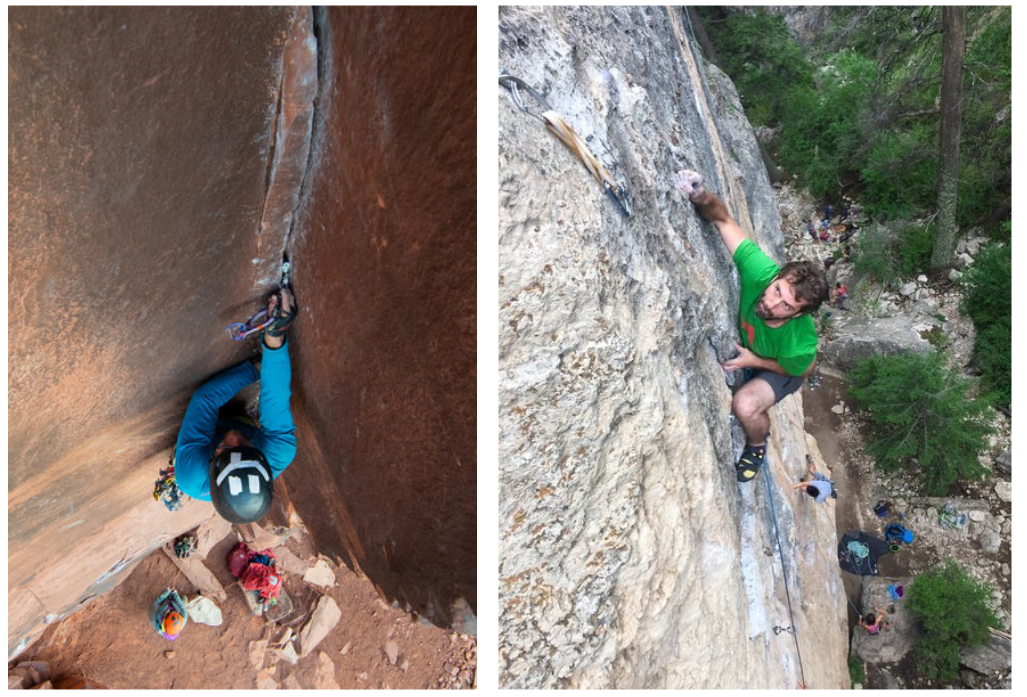 Placing a Cam (Left), Approaching a Bolt (Right) [Source 1] [Source 2]
Multi-Pitch vs. Single-Pitch
For a given trad or sport route, it may be composed of a single pitch or multiple pitches. A pitch typically ends at a logical rest such as a ledge, or for convenience sake before a large traverse or difficult section. A pitch is typically 80-120ft. long. Some climbs are single-pitch, and one simply climbs up and returns to the ground. Some climbs are multi-pitch where a series of pitches are climbed. If the route tops out a formation the climbing team may walk off a less technical section of the formation, or opt for a series of rappels.
The important thing to note here is that MP does a poor job providing adequate data for a multi-pitch climb. It lists only a single length and grade for the whole climb, providing no details for individual pitches. Typically a grade is given for the hardest pitch on the climb. The issue is that there is no way to tell if a 4 pitch 5.9 climb is 3 pitches of 5.4 and one 5.9, or 4 consecutive 5.9 pitches. The latter is much more difficult. Typically The details are provided in a description or comment on the climb, but this is entirely unstructured.
The unstructured nature makes a simple regex solution impossible. A cool future improvement would be to use an ML model to identify and extract pitch details even as the format varies wildly.
For now, we just have to consider that multi-pitch data is less useful. This is not the end of the world, as most performance centric concerns typically focus on single pitch climbs anyway.
Data Cleaning
Once the CSV is successfully transmitted to a pandas dataframe, we need to perform bread and butter data cleaning.
Data Type Correction
- Date columns go from string to pandas datetime, and forced to a simple %Y-%m-%d format since day is the highest resolution required.
- Rating, Route Type, Style, Lead Style go from string to pandas categorical type. This saves drastically on dataframe overhead.
- If you provide no star rating for a climb, “Your Stars” outputs as -1 for that entry. This is better as a Nonetype so to not confuse arithmetic.
Data Simplification
- Since climbs can have the same name, we need a real unique identifier other than a basic integer index. The URL provides a unique route identification number which is easily extracted. This is particularly useful as a primary key for this table.
- Location is a list of sub-domains within a major geographic area that ranges from broad areas of a state down to subsections of a specific wall. the primary issue is that there is no way from the basic string itself to detect whether the area is a “sub-area” that contains other areas or a “crag” that contains actual climbs. It would also be nice to know which part of it describes a generally accepted climbing location to differentiate say “Southwest Utah” with “Zion”. We could create such logic but a scraper would need to crawl every sub-domain link and check, and the juice is simply not worth the squeeze. The first entry in a location list is always the US state or foreign country so we can find consistent meaningful information there. Similarly, the very the last entry in a list is usually a crag, wall, or feature that allows us to reliably group nearby climbs together.
- For tick lists, “Pitches” is relabeled as “Pitches Ticked” per the issue spoken about in the previous section. Default number of pitches must be extracted from the scraped route page.
- An SP/MP column is added where a simple binary categorical type of single pitch or multi pitch is applied based on default number of pitches.
- There is a bug where “,” is output as its HTML code “'” in Notes. This is a simple find and replace for readability.
- Route Type Considerations
- Aid, ice, snow, TR only, and strange – but allowed by MP – types such as trad/boulder or NoneType are outright removed. This tool focuses on the big three types of climbing: trad, sport and boulder. Types such as aid or ice and snow are typically more adventure focused and less performance metric focused as this tool intends to serve.
- There is constant debate as to what constitutes trad vs. sport. I eliminate all uncertainty by forcing any trad/sport type to be trad. If it is a little bit trad, it is trad.
- I remove all “alpine” and “TR” tags as they are not useful information
- Rating Considerations. Ratings AKA grades are a mess. Every geographic area has their own system with conversions between them. There are multiple scales within the North American standard YDS and V-Grade systems. There are optional components to a grade such as a mostly deprecated duration roman numeral system and a movie style PG13/R/X risk grade.
- We simplify things greatly by enforcing the Yosemite Decimal System and V-Grade systems, as MP is a North America focused website and that is the system for that geographic area.
- YDS-Vgrade combination grades are sometimes a tall boulder with a style better described with YDS such as a crack or moderate, or a route with a particularly out of character difficult crux. Most often, it is the former, so we assign this type to boulder and remove the YDS part.
- Extract the risk grade from the original grade and assign it to its own column.
- Create a copy of the original grade so future modifications can be undone.
Handling Missing Data and Obvious Errors
MP is pretty good at minimizing missing values. The notable exception is route length, since this is a difficult thing to measure. Missing value rates for length is typically in the 10-15% range for a given area. I keep things simple by assigning a basic default value of 70ft for a roped climb and 12ft for a boulder. Admittedly this is pretty bad if we plan to do any meaningful analysis on this value. Luckily, this value is simply not worked with very much within the scope of this project.
An improvement on this system would be to sample all climbs within the same area and assign a mean or median value. This would increase the likely accuracy significantly.
As with all user submitted data, there are often typos and errors. We can easily catch egregious mistakes with a basic minimum and maximum value, based on the tallest and shortest known climb. Otherwise, we frankly have no way to know. This gives additional reason to not utilize this value if possible, since its integrity is particularly problematic.
That is to say that even if someone tries their best to report an accurate length, it is subject to all sorts of real world error sources. No one is carrying a measuring tape, most are estimating by eye based on the rope they are climbing with to the nearest 10ft or so. Then there is the age old argument of whether to only count base to summit elevation gain, or include traverses and down-climbs. It can make your head spin.
Grade Homogenization
This is a big one. For YDS, the letter grade system is the standard and is as follows:
5.0, 5.1, 5.2, 5.3, 5.4, 5.5, 5.6, 5.7, 5.8, 5.9, 5.10a, 5.10b, 5.10c, 5.10d, 5.11a, 5.11b, 5.11c, 5.11d, 5.12a, 5.12b, 5.12c, 5.12d, 5.13a, 5.13b, 5.13c, 5.13d, 5.14a, 5.14b, 5.14c, 5.14d, 5.15a, 5.15b, 5.15c, 5.15d.
So it goes up by 1 up to 5.9, where then each number grade gets four letter grades. If it looks confusing it’s because it was cobbled together in pieces over the years, but it is what we have.
To complicate things further, there exists a sign scale using “+” and “-“ versions of each number grade:
5.0, 5.1, 5.2, 5.3, 5.4, 5.5, 5.6, 5.7, 5.7+, 5.8-, 5.8, 5.8+, 5.9-, 5.9, 5.9+, 5.10-, 5.10, 5.10+, 5.11-, 5.11, 5.11+, 5.12-, 5.12, 5.12+, 5.13-, 5.13, 5.13+, 5.14-, 5.14, 5.14+, 5.15-, 5.15, 5.15+.
There is also a strange letter mix system that is similar in function to the sign scale:
5.10a/b, 5.10b/c, 5.10c/d, 5.11a/b, 5.11b/c, 5.11c/d, 5.12a/b, 5.12b/c, 5.12c/d, 5.13a/b, 5.13b/c, 5.13c/d, 5.14a/b, 5.14b/c, 5.14c/d, 5.15a/b, 5.15b/c, 5.15c/d.
It is not consistent, but often-times a letter grade mix such as 5.11c/d is used to say that it is either a tough 5.11c or easy 5.11d. This is comparable to 5.11+, which may mean the same thing. Or it may mean it is a tough 5.11d, depending on the mood of whomever claimed the grade.
If we wanted to homegenize between the three variations, it is easy to assign the basic letter grade to a sign type. For example a 5.10a is a 5.10-, a 5.10b and 5.10c are 5.10, and a 5.10d is a 5.10+. This leads to imbalanced binning and a reduction of resolution. This is what MP does because it is easy and requires no user input.
Alternatively to go from a sign or letter mix grade to a letter grade, you need to assign it up or down. This provides resolution at the expense of inaccuracy. I thought about allowing the user to manually assign these values based on their opinion, but that seemed like a lot of work to ask of a user. Additionally, if they had not yet climbed it, how could they know? I settled on allowing the user to make their own choice on which scale to use, and how to round. I prefer the letter system and a randomized equal sampling of rounding up and down as it provides a fair inaccuracy and the best resolution.
The same choice must be used for boulder V-grades, but it is a choice between a flat no-sign system and one with “+”s and “-“s.
Consider the following grade conversion chart, and imagine that this does not even consider the subtler variants!
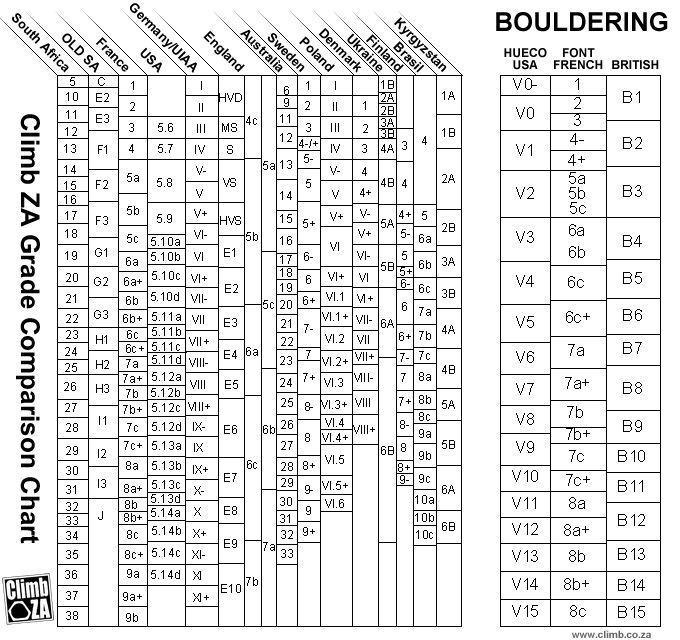 You may want an aspirin after trying to make sense of this [Link]
Scraping
I prototyped with Requests. It is as simple and easy to use as they say. It became apparent that I was IO bound on this task, as a scrape of ~1000 routes could take upwards of 45 minutes. I switched to Grequests for asyncronous scraping. Using 100 agents reduced the scrape time by about 80%, awesome! Or at least it was, until I integrated the scraping script into my streamlit script. The issue is that streamlit itself uses asyncronous protocols, and if you’ve ever used async code, it is finnicky on ensuring the async expressions are consistent across the entire call stack. Since I was not about to dive into the inner layer code of streamlit, I accepted that my users might just have to be patient, bummer.
This ended up being a moot point since as I was deliberating this, MP updated their website to use javascript to load in content. This required a change to Selenium in order to wait for the content to load, then repeatedly click a “load more” button so I could have all of the available data. As such, my scrape got even slower by ~20%. One of the more difficult setup issues this presented was figuring out how to reliably install the required web driver on the Linux distro that the streamlit cloud instance utilized. This was a good lesson on the classic merits of developing on the same OS you will be deploying to. I found a premade docker image that is intended for developing streamlit cloud apps. Luckily, I was able to get things running with a few smart github commits, and never needed to spin it up. It is usually a good idea to at least try your luck at the lazy way once or twice.
MP was updating their website, and let’s just say it wasn’t the smoothest roll out. Where I was previously able to get away with minimal error handling, now page requests were failing left and right for a multitude of reasons. I implemented retry protocol and error handling. Sometimes no matter what you do, you can’t get a page. I had to implement handling for all downstream scripts to allow for a Nonetype scrape and the subsequent Nonetype data generated from it. Again, good practice was thrust upon me.
HTML Parsing and Regex
Once the pages are downloaded, we need to extract ordered data from the raw html. The goal for this project centered around the tick list of a given climb. The data was mostly organized. The name was in its own cell, but the rest was lumped into a single cell. The date could be separated using the “·” character as a reference, and then intelligent regex could separate the style and lead style comment from the user note. We also had to handle “private ticks” which I decided to drop as they contained largely incomplete information. Other elements of bad data that must be accounted for include illogical dates, such as “2” and “20003” which for some reason are allowed by MP. Then there is more surprising issues like emojis and oomlots messing with my regex.
A nice lesson learned here was utilizing the lxml parser as opposed to the standard beautiful soup parser. With this set up, I was able to improve my parsing time by ~15%. A worthy improvement.
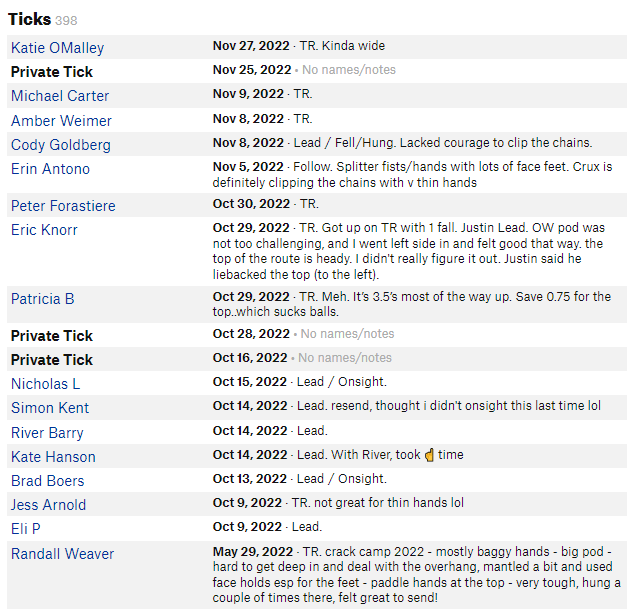 Example Tick Data Source
Tick Dataframe Cleaning
Once an individual climbs tick dataframe is constructed, it needs to be cleaned up like any other dataset.
- Missing data needs to be handled as Nonetype.
- Dates turned from strings to datetime objects.
- Viable columns turned to categorical type.
- Bogus or incomplete entries dropped.
Metric Computation
With my dataset constructed, the fun really begins. Many of the metrics are easy to calculate, simple sums and ratios.
Others were more complicated such as “Mean Attempts to RP”, which required multiple steps and checks. We want users who had to work for their redpoint, so this excludes users who flashed or onsighted, then returned for a redpoint later. Also, we want only the attempts prior to the first redpoint. We must:
- Group ticks by user.
- Remove climbers who flashed or onsighted.
- Detect users who redpointed.
- Sum all attempts strictly prior to the date of that first redpoint.
Another good example is the “attempts to send” metric that is calculated for a users climbing pyramid. This simply counts how many attempts it took a user to climb a given route cleanly. The difficulty mostly lies in that how a given user ticks attempts can vary. The cleanest way is to create a separate tick for each attempt, but few people do that. Many people will tick multiple pitches on a single pitch climb to designate how many attempts they gave it. I provided logic that detects this.
How to handle multi-pitch climbs is even more difficult, as most people use the pitches feature to record how many pitches they broke the climb into themselves. Perhaps they linked pitches or didn’t climb to the top. This is a completely different utilization of the same metric. Agony. I then implemented logic that detects if a climb is a multipitch, if it is, it will simply tally up ticks instead of pitches. Again, multipitch gets the short end of the stick, but we simply have to do the best we can with imperfect source data.
These computations ended up making this step CPU bound. I was able to improve performance by ~20% using Pandarallel parallel threading. This ended up dying the same fate that async did, as it just did not play well with Streamlit.
Streamlit and Front End Considerations
I’m not kidding myself, Streamlit makes the front-end implementation of all of this code pretty idiot proof. Still, some elements I’m most proud of are:
- Making all elements display logically despite different types of data sets, user inputs, data quality etc.
- A hand picked consistent color theme across charts.
- Complete filtering which allows for full customization of dataset analysis by the user.
- The filtering components can be relocated to the sidebar to allow for tinkering while viewing key charts.
- Multiple options for sub-type partitioning key charts by key categorical types and time groupings.
- Slick customizable interactive tables using Aggrid, complete with hyperlinked route names for easy referencing.
- Memoization and caching to reduce redundant computation by Streamlit.
![Frontend Ex]() Complex type and time partitioning
Complex type and time partitioning
Some Ideas For Future Improvement
- Allow a user to update their scraped file. Currently one has to re-scrape their entire list whenever an update is desired. It should not be too hard to detect new entries, the real work is integrating it into the front end without making that section even more complex.
- Area comparison. I’ve already provided area details, but it would be neat to compare areas with box/violin plots and other graphics.
- Try to reduce compute time with parallelization using Swifter + Modin.
- Group ticks into “trips”. Ticks from the same area in a logical time frame can be grouped. This could be useful for a “looking back on” nostalgia type feature.
- Allow feature tagging of routes with tags such as: pumpy, techy, arete, corner, finger-crack etc. It would be extra cool to use an ML model to deduce these tags from description, comments and ticks of a given climb in order to categorize it.
- Improve length metric to make it more reliable. Better outlier/typo detection. Better missing value fill protocol.
- Multi-pitch data is critically underserving. An ML model to create pitch by pitch data from available text would go a long way.
Conclusion
Overall I’m really pleased with how this project turned out. I think I’m most proud how I was able to move beyond pre-constructed analysis on a pre-selected dataset, and allow analysis of any arbitrary MP dataset. Myself and friends have used my tool many times already to identify neat accomplishments and find cool new climbs. I also look forward to creating specific analysis using this code as a launch point.
Thanks for reading!